Unemployment: Static Trends in a Changing Economy
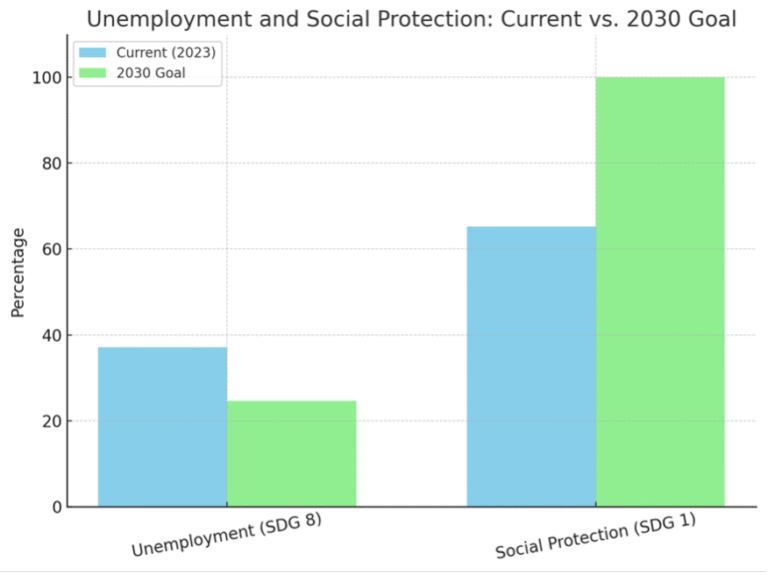
The indicator representing unemployment in the SDG Dashboard places the state at 37.1% against a 2030 target of 24.6%. While this metric aggregates several forms of labor underutilization, including informal and precarious employment, the problem isn’t simply the value itself. What matters is the projection: the state is not on track to meet this goal. The gap of over 12 percentage points is not narrowing in the current trend, suggesting that economic growth alone is not shifting the structure of employment in a meaningful way. This raises structural questions: what is the nature of the new jobs being created, and why are they failing to draw people into formal, stable employment?
From the data, we know that Baja California has thriving urban economies in Mexicali and Tijuana, yet the informality and precarity embedded in these markets are not being addressed at the scale needed. If the labor market is segmented, with high-skill workers accessing benefits and low-skill workers excluded, interventions must shift from sector-neutral job creation to targeted, inclusive employment strategies. Workforce development programs need to focus not just on skills, but on pathways to formalization. Moreover, fiscal and regulatory frameworks need to be reassessed to lower the entry cost for businesses into the formal economy, especially in low-productivity sectors. Without structural labor market reforms, the gap will persist well past 2030.
Social Protection: Uneven Coverage, Predictable Outcomes
Access to social protection systems is one of the clearest indicators of institutional inclusion, and Baja California’s average coverage sits at 65.3%—far below the universal goal of 100%. The story becomes more interesting at the municipal level. In municipalities like Mexicali (61.1%) and Ensenada (50.1%), access hovers close to the state average, but others such as Playas de Rosarito (35.7%) and San Quintín (38%) reveal stark disparities. These gaps are not marginal. They are structurally significant, and the dashboard’s projections show that no municipality is on track to reach full coverage by 2030 if current trends hold.
The underlying mechanisms are not surprising. Informality drives exclusion, and exclusion compounds disadvantage. Municipalities with lower access to formal jobs—often those with high seasonal or agricultural labor—predictably exhibit lower protection coverage. But understanding this isn’t enough. The challenge is in translating these gaps into interventions. Mobile enrollment programs targeting informal workers, especially in rural municipalities, could close some of the access gaps. Beyond outreach, there is a need to modernize the portability of benefits across employment types. Formality and informality should not be binary conditions but points on a continuum, and the architecture of the protection system should reflect that. If 35% of the population remains outside the system by 2030, the consequences will not be abstract—they will be measurable in health outcomes, retirement insecurity, and intergenerational poverty persistence.
Extreme Poverty: Progress at the Margins, Stagnation at the Bottom
Of the three indicators, extreme poverty is the only one where selected municipalities are projected to meet the 2030 goal of full elimination. Ensenada (1.3%), Mexicali (1.1%), and Tecate (1.2%) are all projected to reach zero or near- zero levels of extreme poverty by the end of the decade. However, this should not obscure the broader trend. Other municipalities, including Tijuana (1.9%), Playas de Rosarito (2.2%), and most notably San Quintín (3.8%), are projected to miss the goal. The implication is that while aggregate poverty is declining, the most vulnerable areas are being left behind.
San Quintín stands out not just for its poverty rate but for the structural rigidity that supports it. As a municipality heavily reliant on agricultural labor, with high informality and low institutional access, poverty here is cyclical and multidimensional. Reducing it will not be possible through income support alone. What’s needed is a territorial approach—one that integrates employment, housing, health, and education interventions at the local level. Poverty is not distributed randomly, and neither should policy responses be. If we continue to treat poverty as an individual shortfall rather than a spatially reinforced outcome, we risk cementing these disparities beyond the 2030 horizon.
The power of the Baja California SDG Dashboard is not in the numbers themselves, but in what the projections tell us: without substantial intervention, the state is not on track to meet its goals in unemployment, social protection, or poverty reduction. But projections are not destiny—they are diagnostics. What they offer is a clear map of the consequences of inaction. For the state, this should prompt a strategic pivot: toward territorially disaggregated programming, toward more inclusive labor policies, and toward a reengineering of the social protection system for universality. The 2030 deadline isn’t just a milestone—it’s a commitment. And every year that passes without course correction makes that commitment harder to keep.
As part of the team that developed the Baja California SDG Dashboard, we aimed to lead a technically sound and policy-relevant effort to track progress toward the 2030 Agenda. I helped steer the dashboard’s first phase by guiding indicator selection, data integration, and the design of the projection methodology. This tool reflects our collective commitment to grounding local decision-making in evidence. Looking ahead, continued investment in tools like this —built on reliable data and forward-looking analysis— is essential to closing persistent development gaps and accelerating progress in Baja California.